
AI Driven Design Shit Database

A project that uses AI to record and analyze personal poop data for health monitoring:
Original Requirement Document
git config user.name "oracle"
git config user.email "[email protected]"

Generate data at intervals of 0 to 5 days, with a maximum of 3 entries per day.

Analyze diarrhea timing (>=3 times per day, or 2 times within 60 minutes)
Count instances of difficult bowel movements (once every 3 days)

Record:
- Defecation time
- Smoothness of bowel movement
0 = blocked
1 = hardly
2 = normal
3 = explosive

Interface: scatter plot
Yearly report
Weekly report (4-7 times considered normal)
docker run -d --name clickhouse-server \
  -p 8123:8123 \
  -p 9000:9000 \
  -v /Users/zeusro/data:/var/lib/clickhouse \
  -e CLICKHOUSE_PASSWORD=123456 \
  clickhouse/clickhouse-server:latest
Prepare Base Data

Prepare Prompts and Distill Responses
- Create a memo on Mac to record project background information
- Download the latest ChatGPT client and feed the memo as background for AI to generate the database and table
- Refine prompts and adjust tables
- Pass customized requirements as new prompts for ChatGPT to generate SQL
Create a database named "shit" with appropriate fields to describe the scenario
Simplify the table above, remove poop_times_today, interval_minutes, notes; all time fields as DateTime, smoothness as Enum
Extend weekly/monthly reports: analyze frequency and intervals
- If >=3 times in a day → diarrhea
- If <=3 times in a week → constipation
Reflect these in weekly/monthly summaries
Finally, extract key information from AI's response:
CREATE DATABASE IF NOT EXISTS shit;
CREATE TABLE IF NOT EXISTS shit.toilet_log
(
    id           UInt64,               -- Unique ID
    log_time     DateTime,             -- Time of defecation (seconds precision)
    smoothness   Enum8(                -- Smoothness of bowel movement
                    'blocked' = 0,     -- Completely blocked
                    'hardly'  = 1,     -- Hardly passes
                    'normal'  = 2,     -- Normal
                    'diarrhea'= 3      -- Explosive
                  )
)
ENGINE = MergeTree
ORDER BY log_time;

INSERT INTO shit.toilet_log VALUES
(1, '2025-04-17 08:30:00', 'normal'),
(2, '2025-04-17 10:10:00', 'diarrhea'),
(3, '2025-04-18 09:00:00', 'blocked');

-- Count explosive bowel movements
SELECT count()
FROM shit.toilet_log
WHERE smoothness = 'diarrhea';

-- Count daily bowel movements
SELECT toDate(log_time) AS date, count()
FROM shit.toilet_log
GROUP BY date
ORDER BY date;

-- 📊 Diarrhea day mark (intermediate table/subquery)
SELECT
    toDate(log_time) AS day,
    count() AS poop_count,
    (count() >= 3) AS is_diarrhea_day
FROM shit.toilet_log
GROUP BY day
ORDER BY day;

-- 📊 Weekly report: diarrhea, constipation, health
WITH
-- Diarrhea statistics
(SELECT
    toDate(log_time) AS day,
    count() AS poop_count
 FROM shit.toilet_log
 GROUP BY day) AS daily_stats

SELECT
    toStartOfWeek(day) AS week_start,
    count() AS total_days,
    sum(poop_count) AS total_poop_count,
    sum(poop_count >= 3) AS diarrhea_days,
    (total_poop_count <= 3) AS is_constipation_week,
    (diarrhea_days = 0 AND total_poop_count > 3) AS is_healthy_week
FROM daily_stats
GROUP BY week_start
ORDER BY week_start;

/*
is_constipation_week = 1 → constipation week
is_healthy_week = 1 → healthy week
*/

-- 📊 Monthly report: diarrhea, constipation, health
WITH
-- Diarrhea statistics
(SELECT
    toDate(log_time) AS day,
    count() AS poop_count
 FROM shit.toilet_log
 GROUP BY day) AS daily_stats

SELECT
    toStartOfMonth(day) AS month_start,
    count() AS total_days,
    sum(poop_count) AS total_poop_count,
    sum(poop_count >= 3) AS diarrhea_days,
    (total_poop_count <= 12) AS is_constipation_month,
    (diarrhea_days = 0 AND total_poop_count > 12) AS is_healthy_month
FROM daily_stats
GROUP BY month_start
ORDER BY month_start;

/*
is_constipation_month = 1 → constipation month
is_healthy_month = 1 → healthy month
*/
Import Data
Generate at least 400 test entries based on this table structure, with log_time and smoothness randomly distributed.
0-3 entries per day.
Export as CSV.
Date range: 2024-01-01 to 2025-04-17.
Import CSV into ClickHouse on Mac using clickhouse client.
brew install clickhouse
# Allow clickhouse command execution with privacy settings
clickhouse client --host=localhost --port=9000 --user=default --password=123456 --query="INSERT INTO shit.toilet_log FORMAT CSV" < /Users/yourname/toilet_log_data.csv
Then check results via tabix.
SELECT
    count() AS all
 FROM shit.toilet_log
Application Layer Design
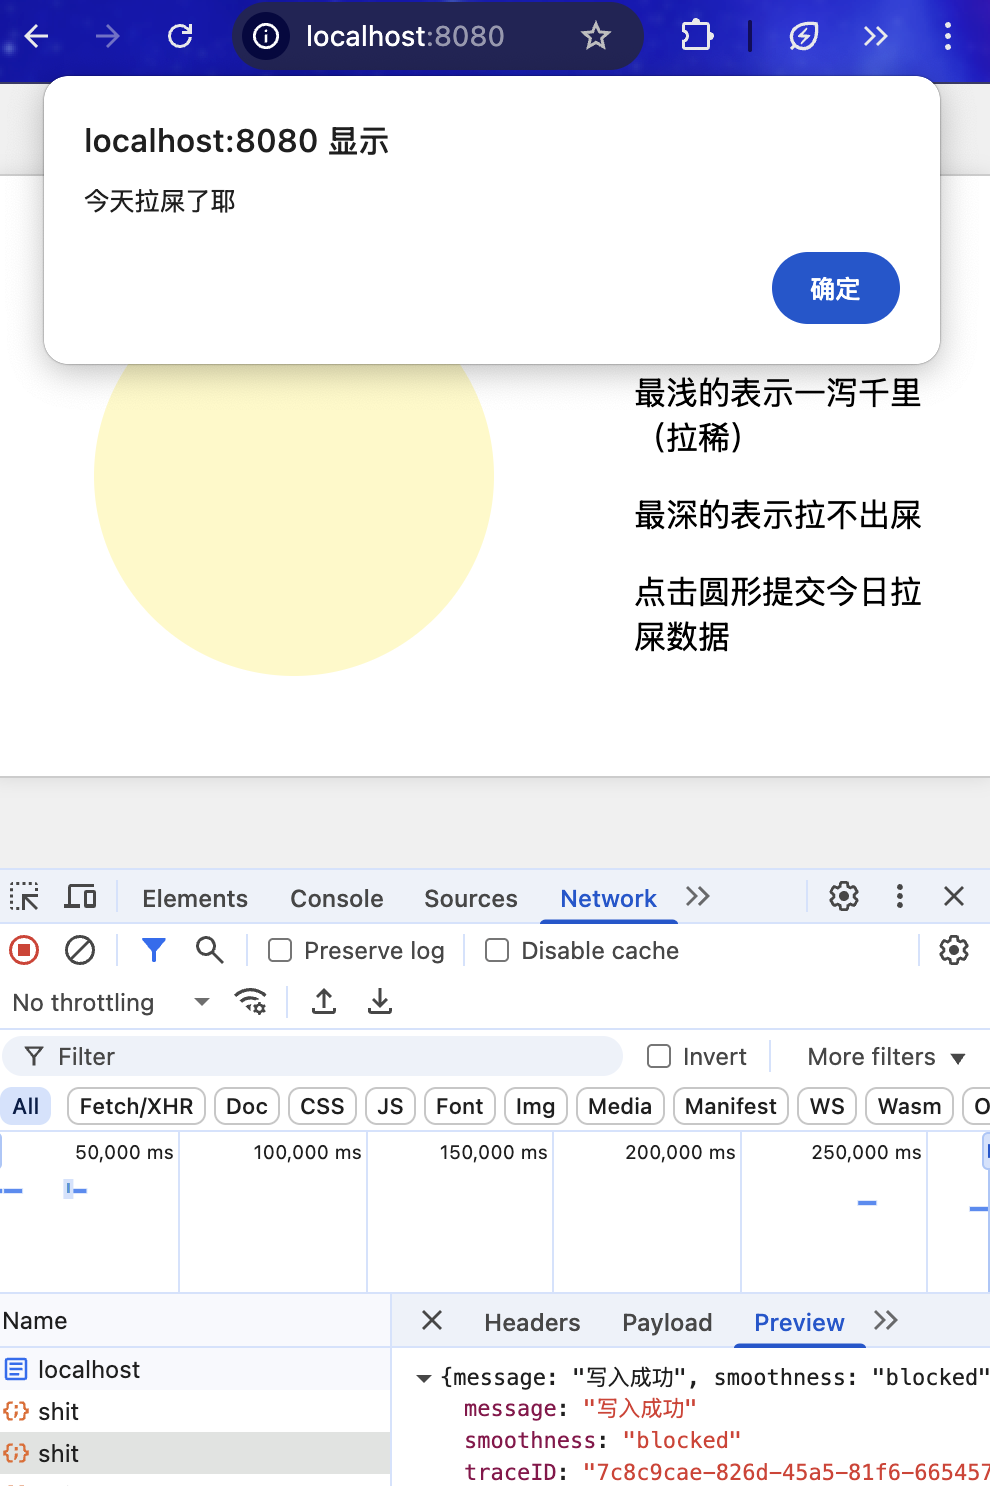
Design a page with a yellow circle in the center, a scrollbar to its right.
Scrolling deepens the yellow color gradually in 4 steps.
Use pure HTML without external plugins.
Support Windows, Mac, iOS, Android.
Clicking the image triggers a POST with {"smoothness":1} (1-4, 4=deepest color).

Use Gin as web framework, enable basic logs and traceid.
Add index.html page.
Add "/shit" route delegated to Shit method.
Shit method writes into clickhouse table shit.toilet_log.
Create docker-compose.yml to launch Gin and ClickHouse together.
Minor adjustments and it can run immediately.
Complete project: shit
docker compose up --build
Design Inspiration
Inspired by past experiences:
As a merchant once said, "If life gives you lemons, make juice and drink it."
Similarly, if someone poops above you, record it, extract key information, and use it at the right time.
TODO
Current visualization is done with tabix.
SQL-based weekly/monthly report interface can be built but left for later.
- Integrate weekly/monthly charts and provide corresponding data and APIs